The Disabled Student Experience
6 principles for the Disabled Student Experience
Disabled students should be able to access their education on equal terms with their non-disabled peers. The six principles below constitute a framework for what this looks like in practice.
For each of these principles, Disabled Students UK has set a number of goals for the disabled student experience in 2033. The goals take into consideration both the current state of the sector and that there are best practice examples enabling the sector to reach the goals within 10 years. The goals have been created in consultation with disability staff as well as the wider disabled student community.
Below we have positioned these goals alongside the current experience of disabled students. To navigate this section, please use the headings below.
Principle 1: Universal Design
Disabled Students should be greeted by an environment, practices and policies that have been designed with accessibility in mind.
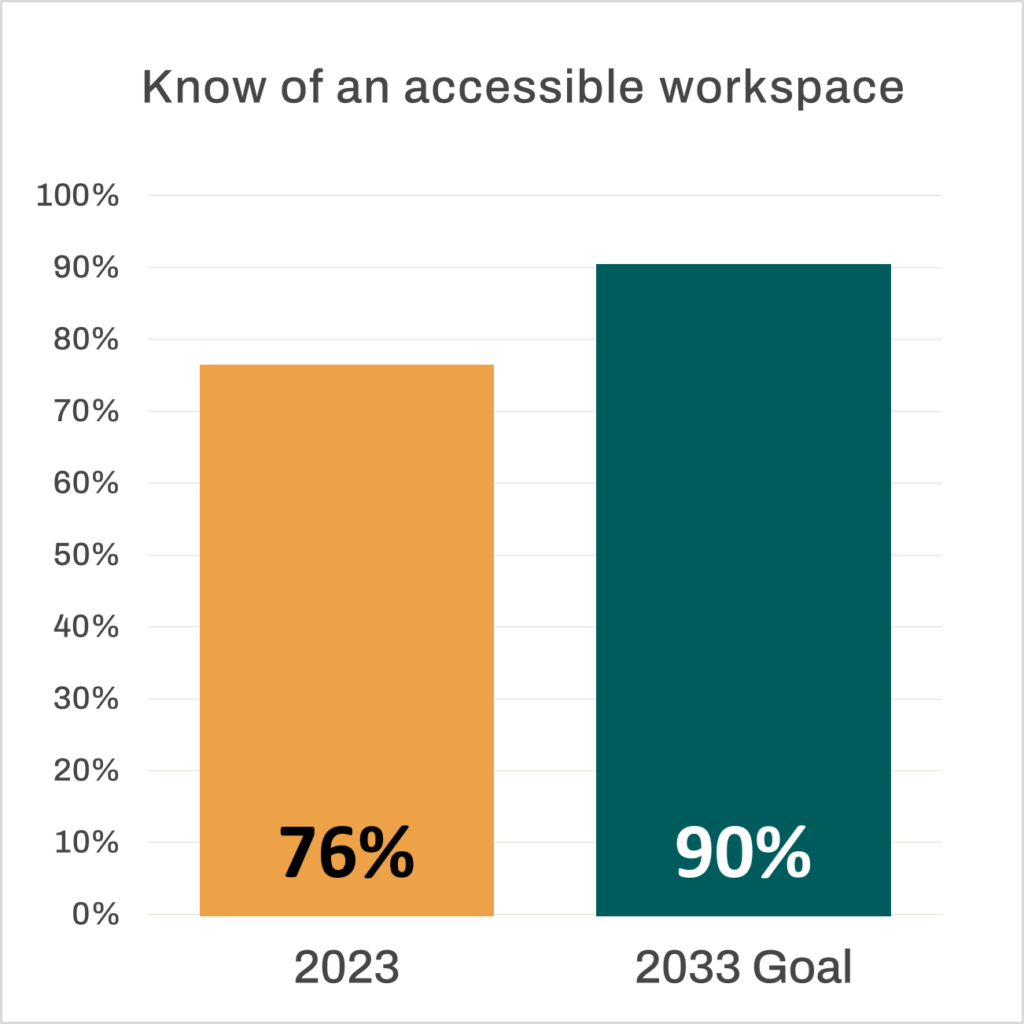
Physical and Sensory Environment
By 2033 90% of students should know of at least one workspace on campus that is completely accessible to them
Currently 76% know of a workspace on campus which is completely accessible to them
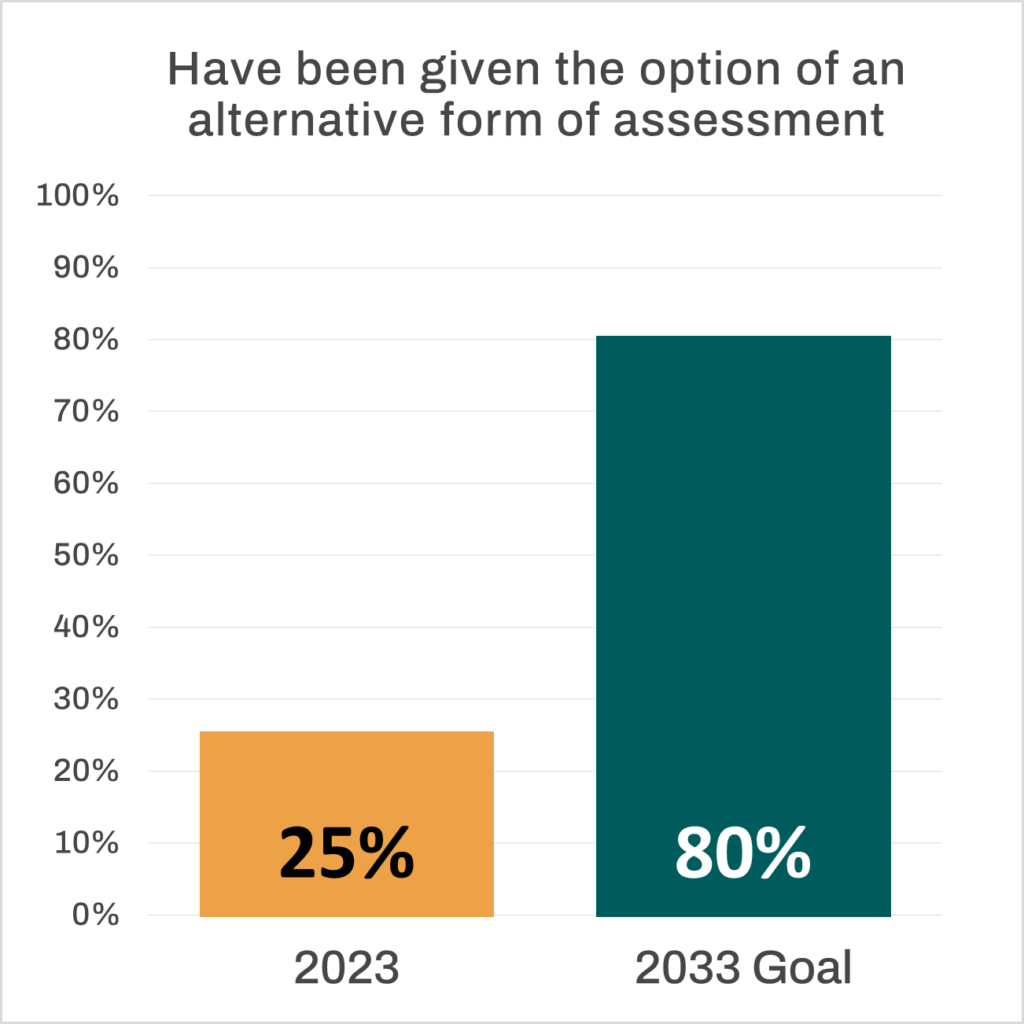
Assessment
By 2033 80% of students should have been given the option of an alternative form of assessment for at least one of their assessments
Currently 25% have been given the option of an alternative form of assessment for at least one of their assessments
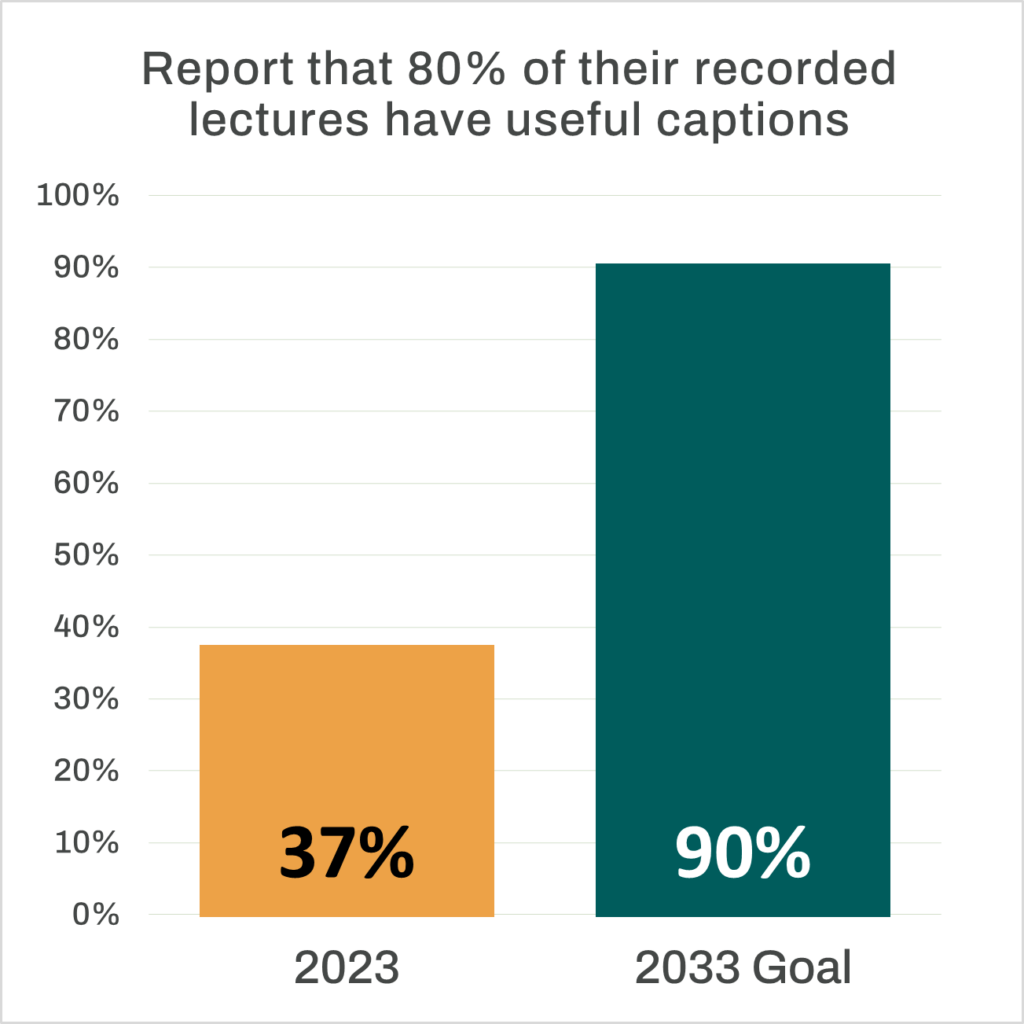
Digital Environment
By 2033 90% of students should find that the vast majority of recorded lectures have useful captions*
Currently 37% report that the vast majority of recorded lectures have useful captions*
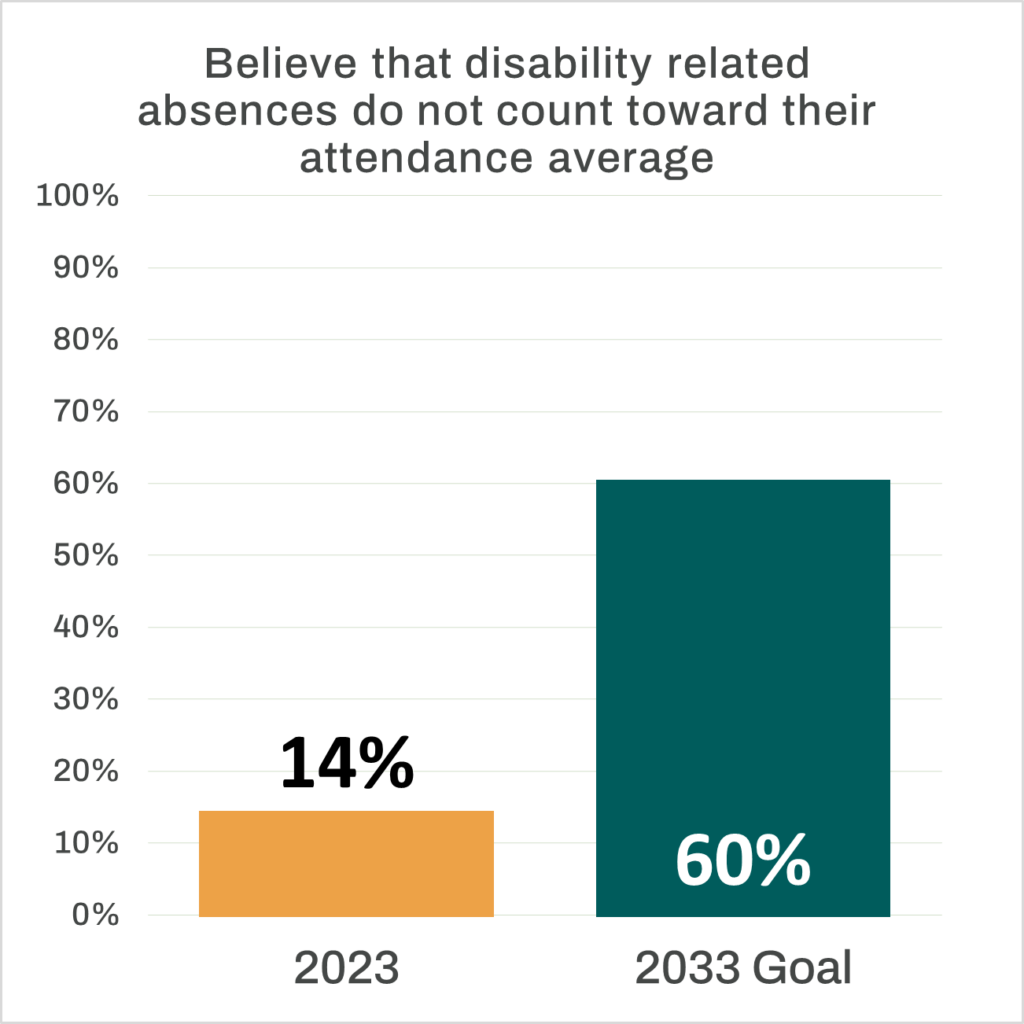
Policy
By 2033 60% of students should know that disability related absences do not count toward attendance averages
Currently 14% are aware that disability related absences ought not to count toward attendance averages
Principle 2: An Inclusive Culture
Disabled students should experience a positive culture at their institution, which promotes inclusion, belonging and a healthy approach to productivity.
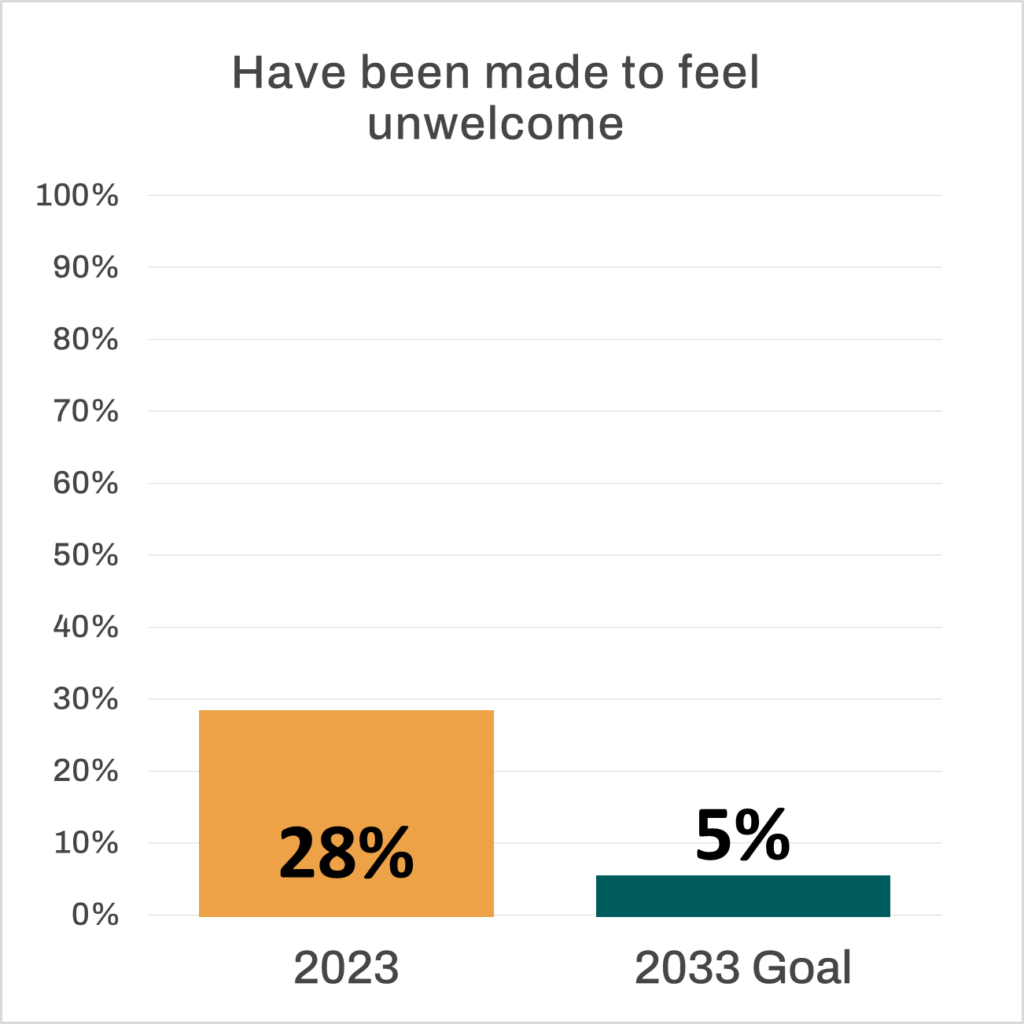
Inclusion
By 2033 fewer than 5% of students should have been made to feel unwelcome at their university by staff members due to their disability
Currently 28% have been made to feel unwelcome at the university by staff members due to their disability
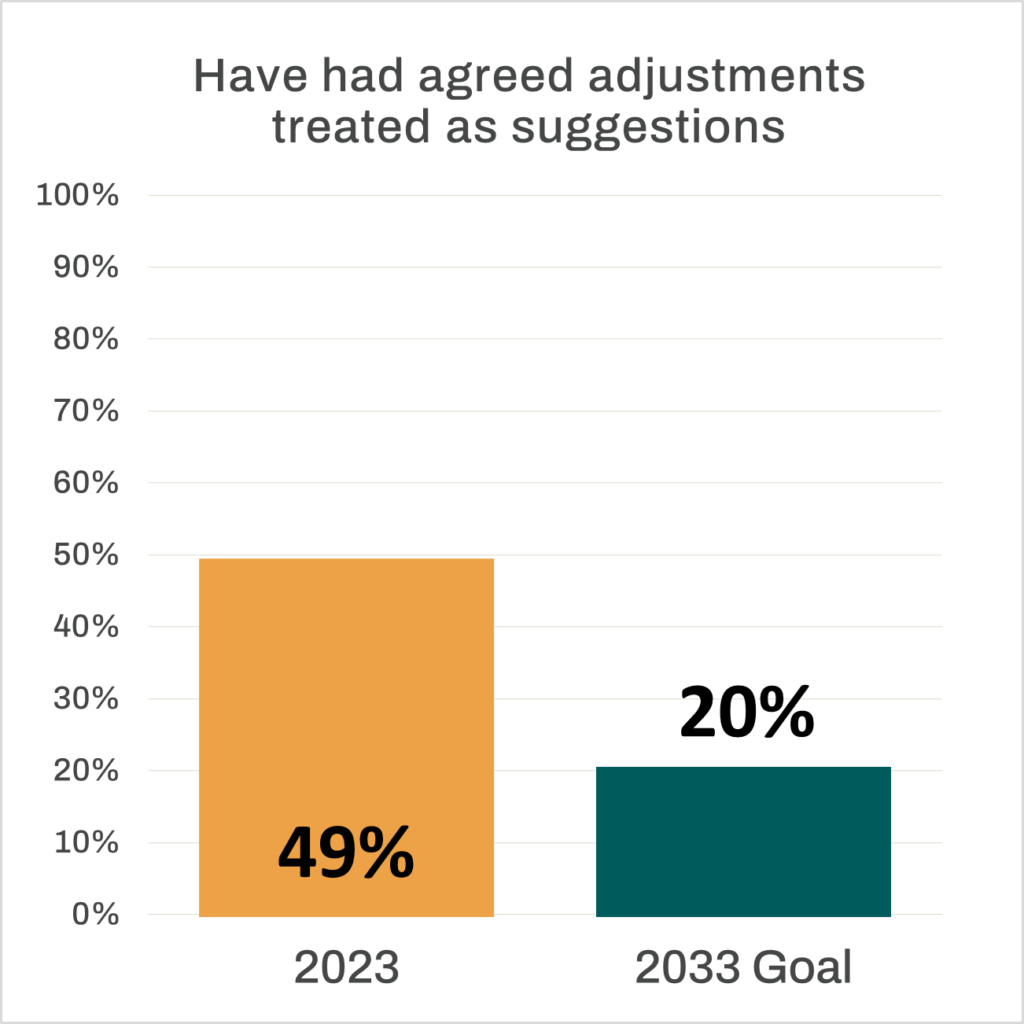
Implementation of Support
By 2033 fewer than 20% of students should have had a staff member treat their agreed adjustments as mere suggestions
Currently 49% have had a staff member treat the adjustments agreed for them as mere suggestions
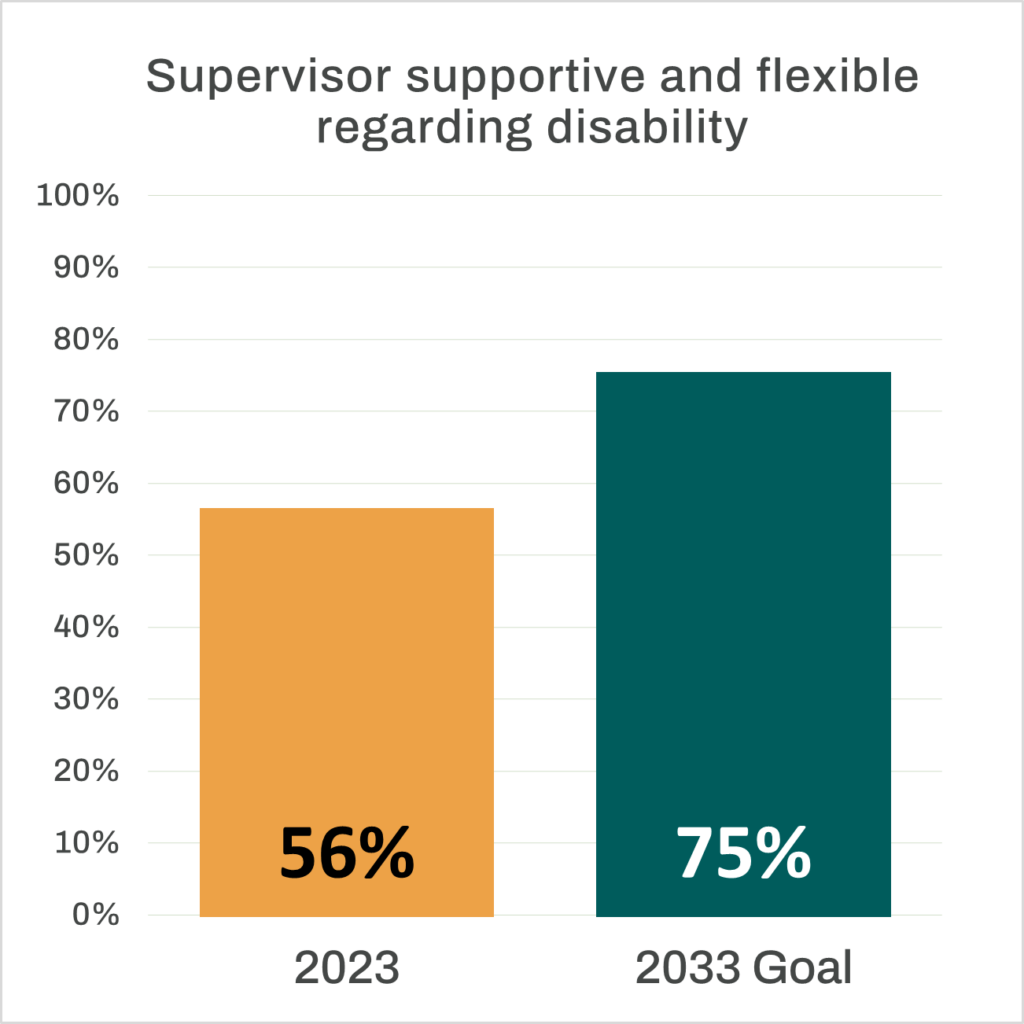
Important Relationships
By 2033 75% of research students should find their supervisor supportive and flexible when it comes to their disability and access needs
Currently 56% of research students find their personal tutor or supervisor supportive and flexible when it comes to their disability and access needs
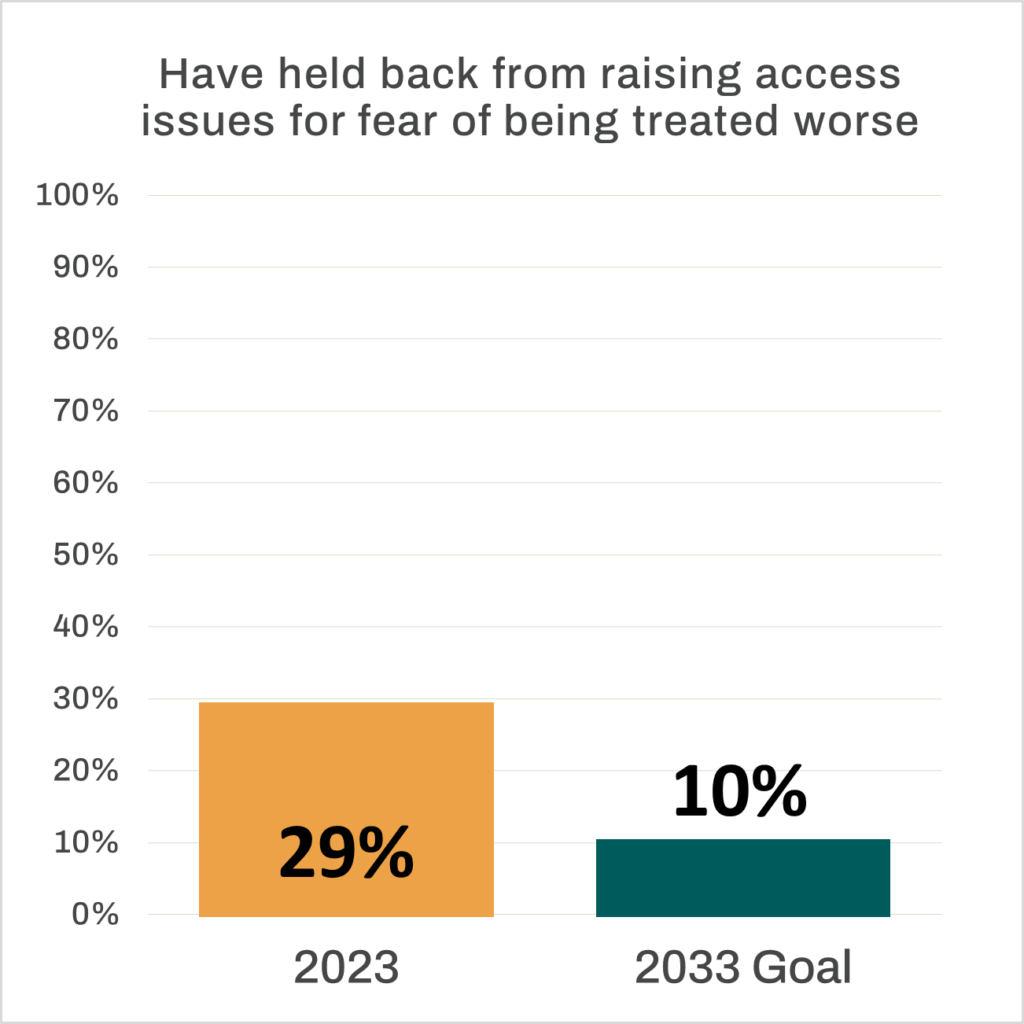
Asking for Support
By 2033 fewer than 10% of students should state that they’ve held back from raising access issues because they have been afraid they will be treated worse or it will affect their academic prospects
Currently 29% have held back from raising an access issue because they were afraid they would be treated worse or it will affect their academic prospects
Principle 3: A barrier-free path to support
Disabled students should not have to go through a process which puts them at a disadvantage in order to receive individualised adjustments.
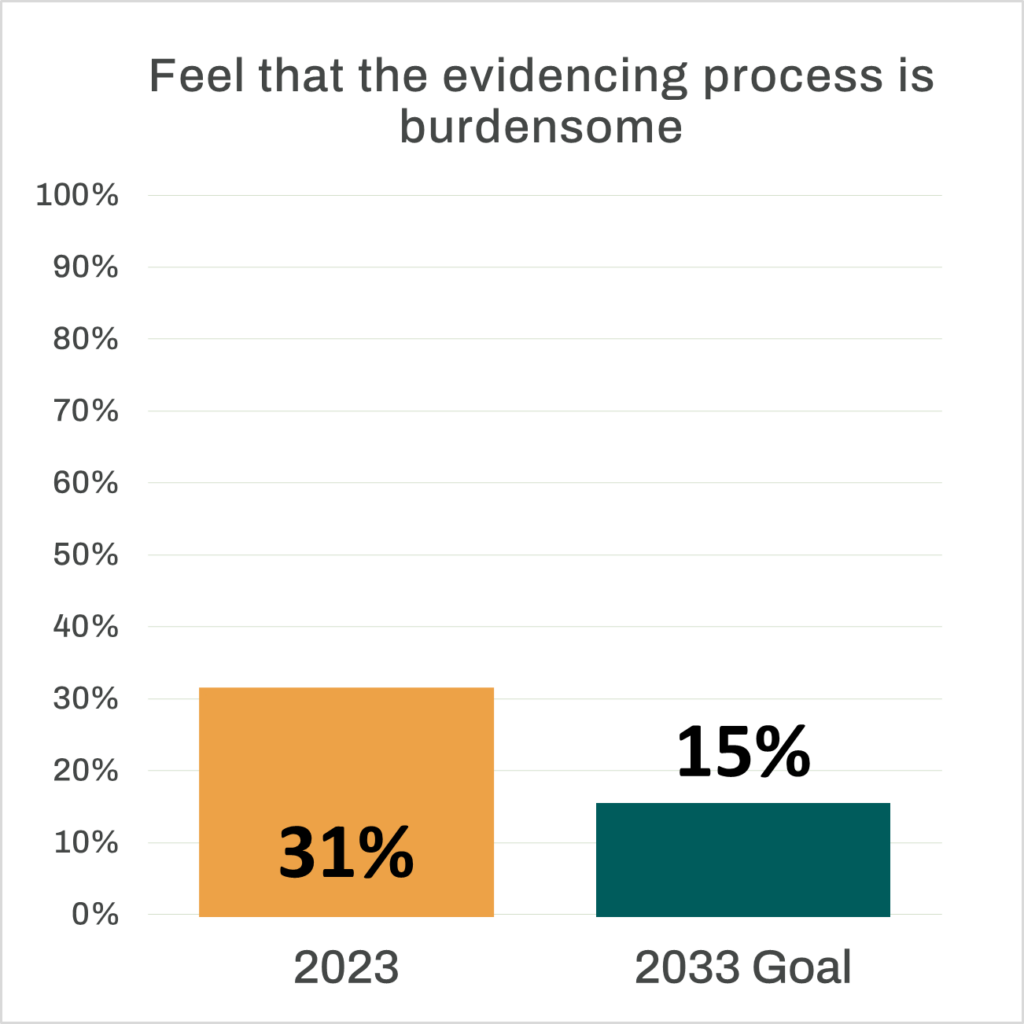
Evidencing
By 2033 fewer than 15% of students should feel that the evidencing process is burdensome
Currently 31% feel that the evidencing process is burdensome
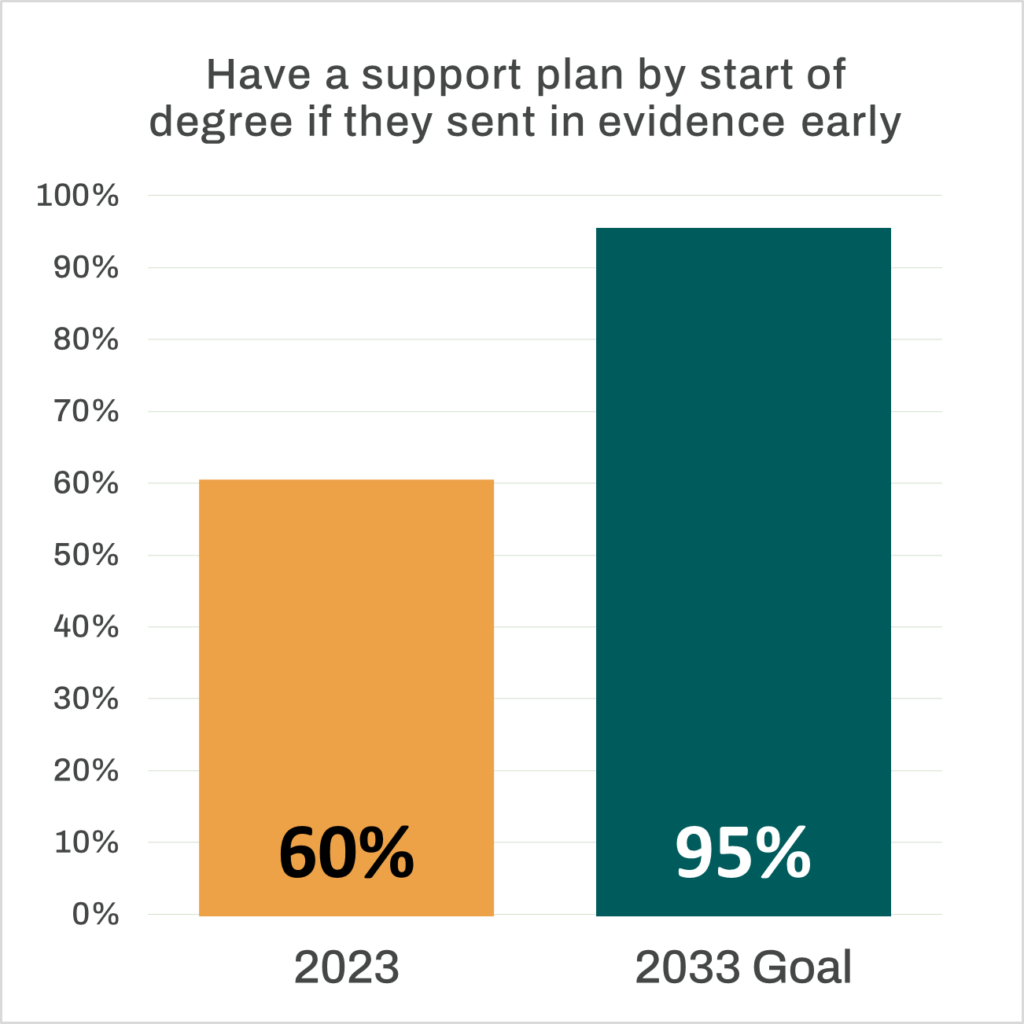
Timeline
By 2033 95% of students who sent in evidence of their disability more than 2 months before starting should have a support plan in place by the time their degree starts
Currently 60% of those who send in evidence more than 2 months before starting have a support plan in place by the time they start
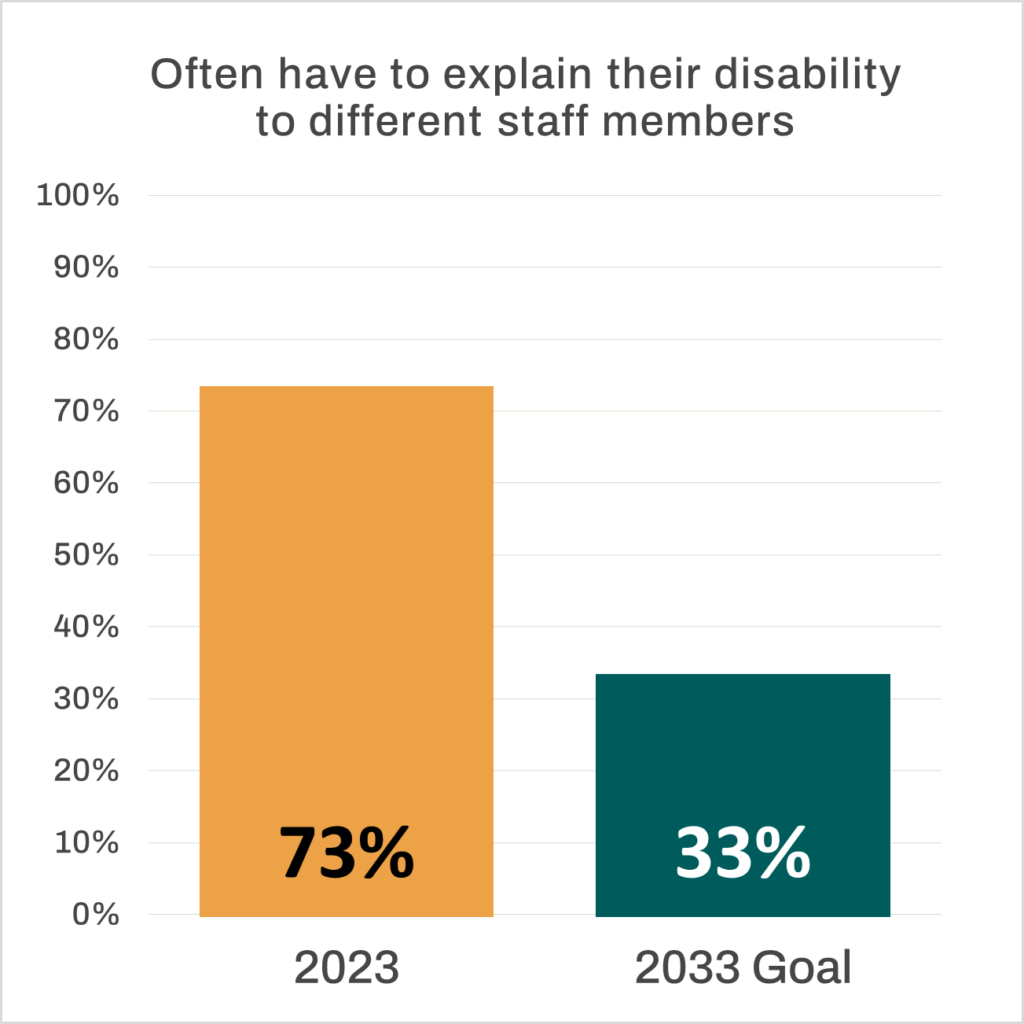
Repeated Disclosure
By 2033 fewer than a third of students should feel that they often have to explain the same thing about their disability or access needs several times to different staff members
Currently 73% report often having to explain the same thing about their disability or access needs several times to different staff members
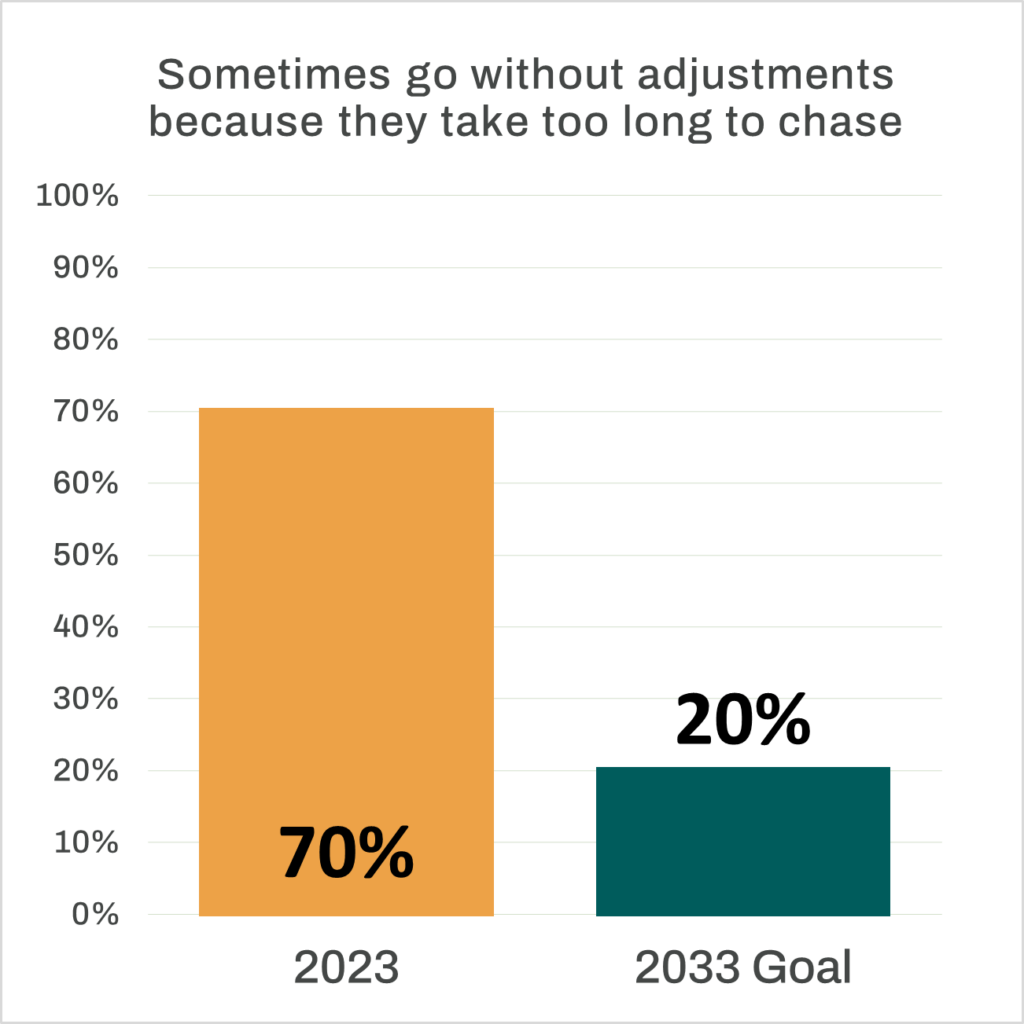
Follow up
By 2033 fewer than 20% of students should go without adjustments that have been agreed for them because it takes too much time and energy to ensure they are put in place
Currently 70% go without adjustments that have been agreed for them because it takes too much time and energy to ensure they are put in place
Principle 4: Sufficient Adjustments
Disabled students should receive all reasonable adjustments needed to enable them to access their degree on equal terms with their non-disabled peers.
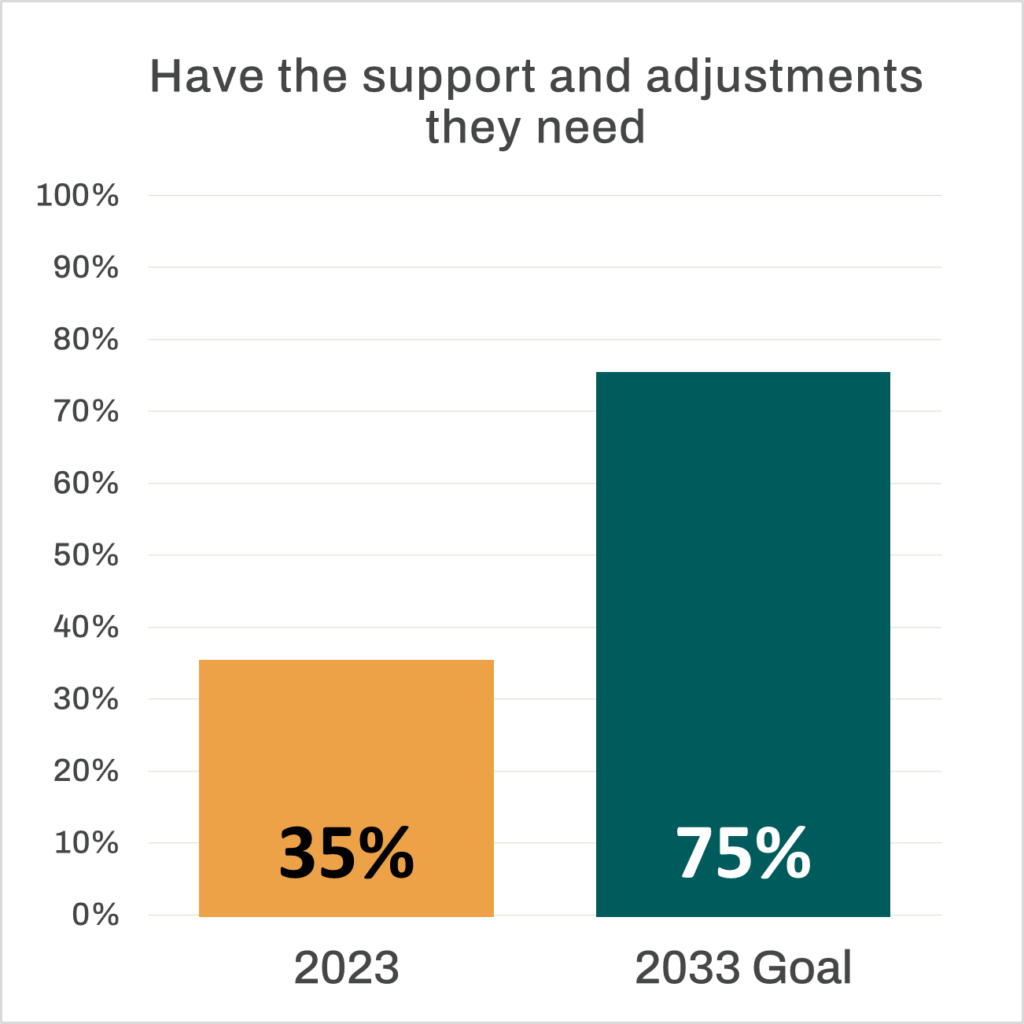
Result
By 2033 75% of students should have all the support and adjustments they need to access their degree on equal terms with their non-disabled peers
Currently 35% have all the support and adjustments they need to access their degree on equal terms with their non-disabled peers
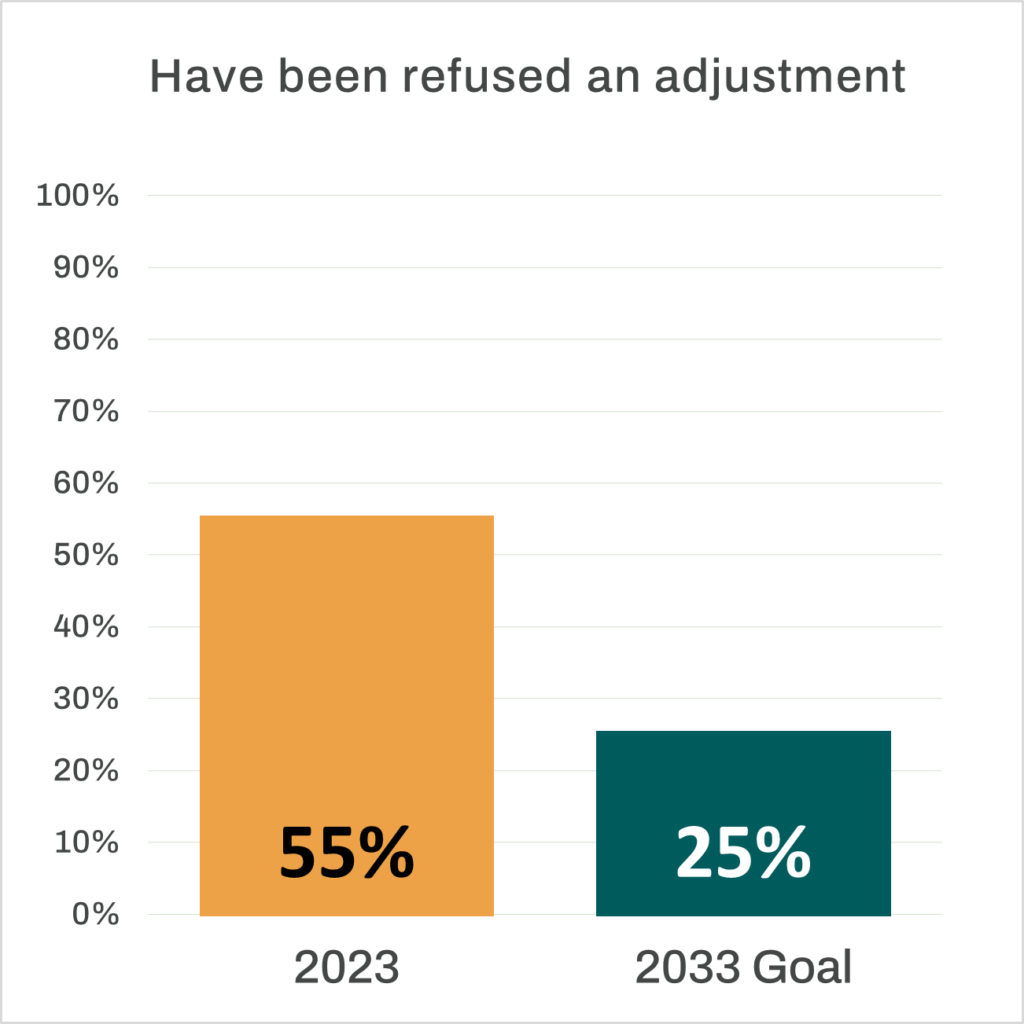
Adjustments Agreed
By 2033 fewer than 25% of students who have asked for adjustments should have been refused an adjustment which would make their experience more equal to that of a non-disabled student
Currently 55% have been refused an adjustment which would make their experience more equal to that of a non-disabled student
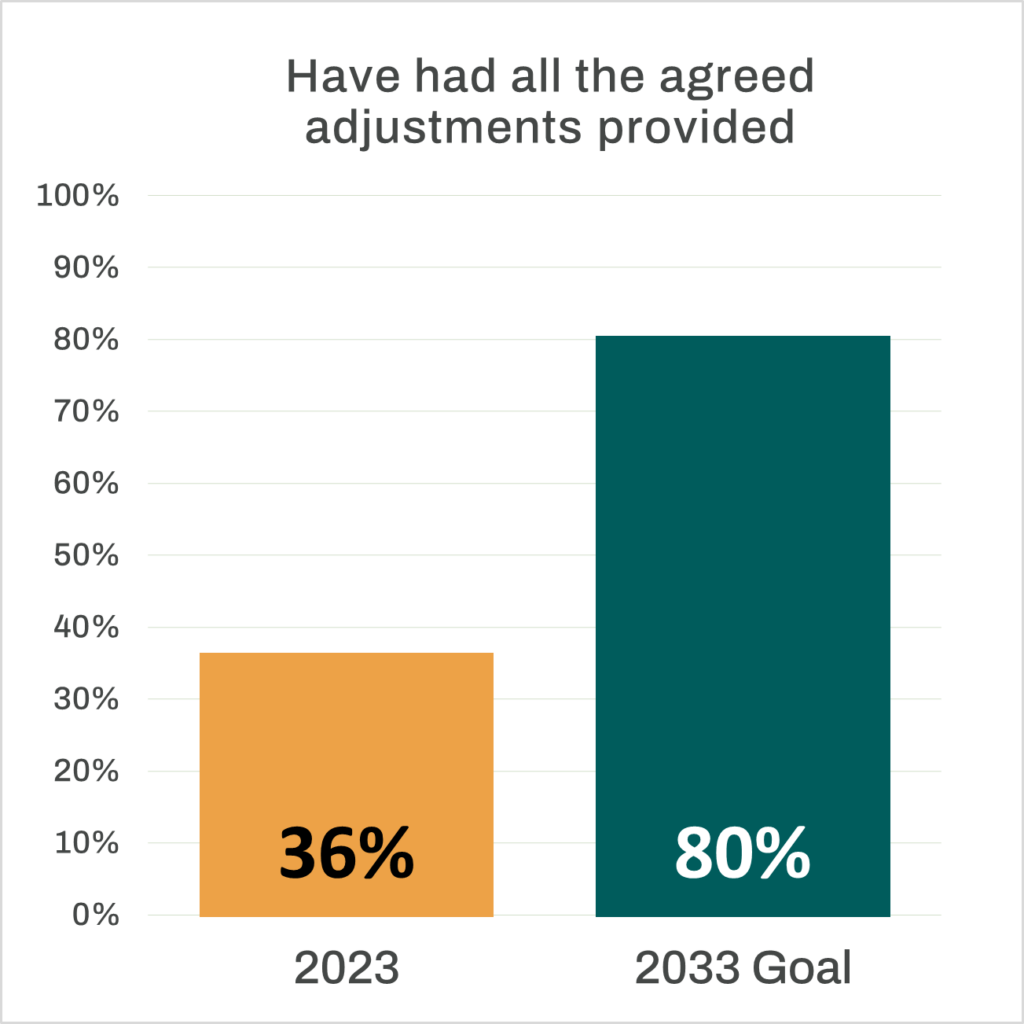
Adjustments Implemented
By 2033 80% of students should have all the agreed adjustments provided
Currently 36% have had all agreed adjustments provided
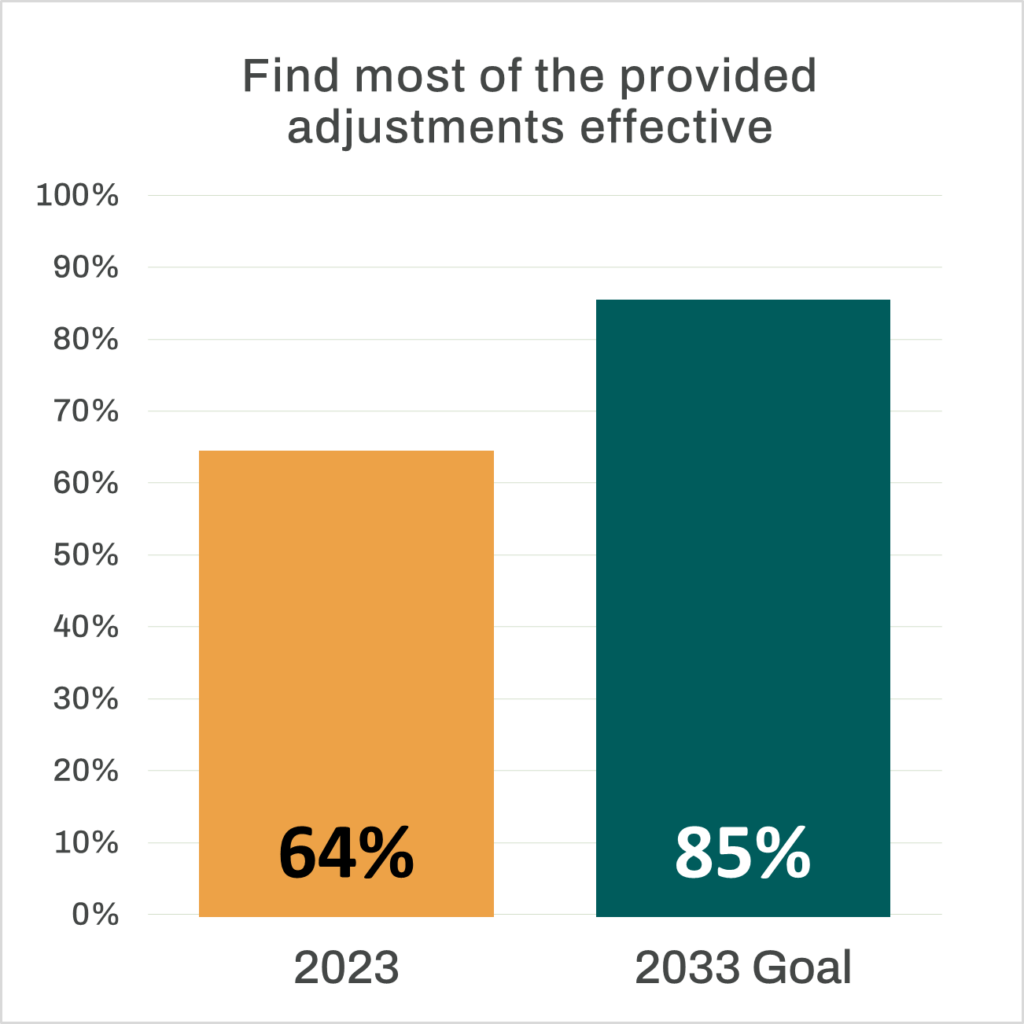
Adjustments Effective
By 2033 85% of students should find the majority of adjustments effective in removing the disadvantage they are experiencing
Currently 64% find most provided adjustments effective in removing the disadvantage they are experiencing
Principle 5: Somewhere to Turn
Disabled students should have a person or place to go to within their institution to effectively resolve accessibility issues.
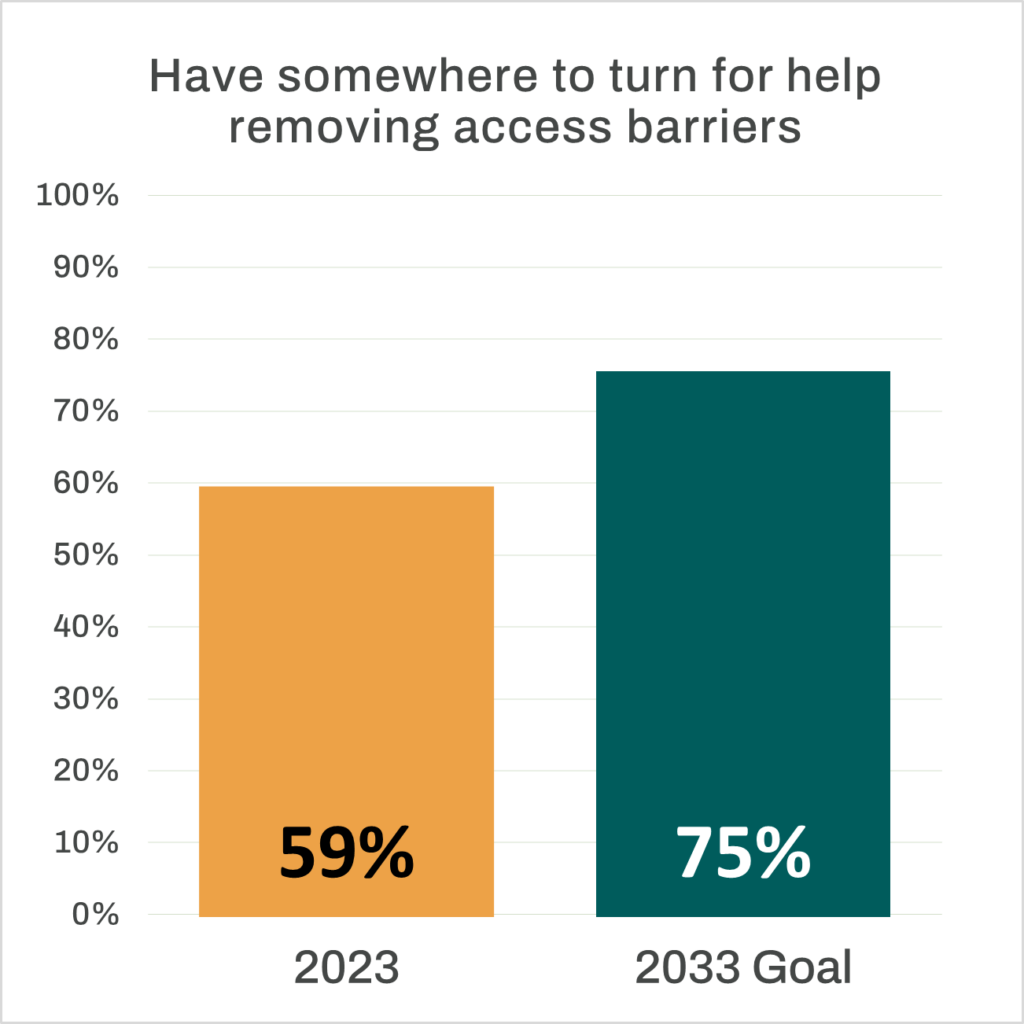
Somewhere to Turn
By 2033 75% of students should feel that there is a system or person they can turn to within the institution who would be able to effectively address the access barriers they may face
Currently 59% feel there is a system or person they could turn to within the institution who would be able to effectively address the access barriers they may face
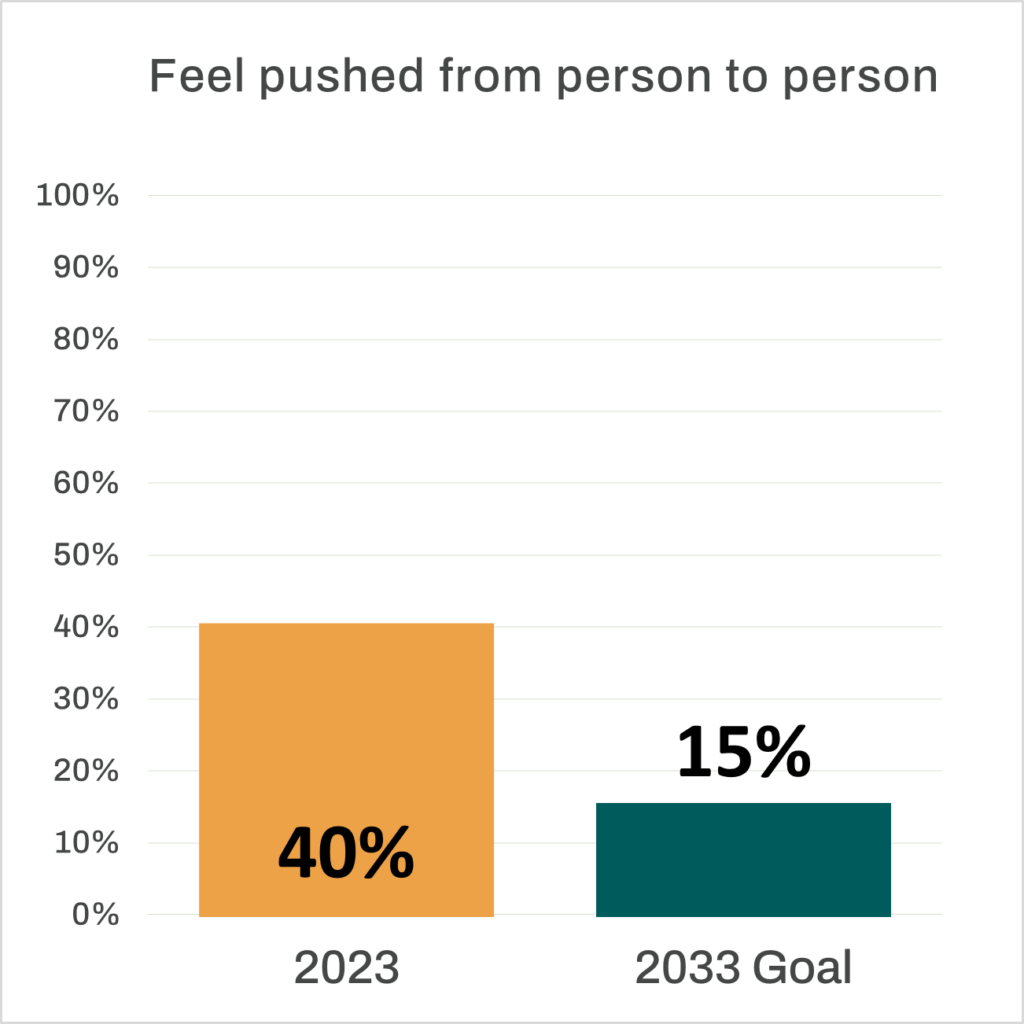
Responsibility
By 2033 fewer than 15% of students should feel pushed from person to person with no one taking responsibility for their access needs
Currently 40% have felt pushed from person to person because it was unclear who is responsible for their access
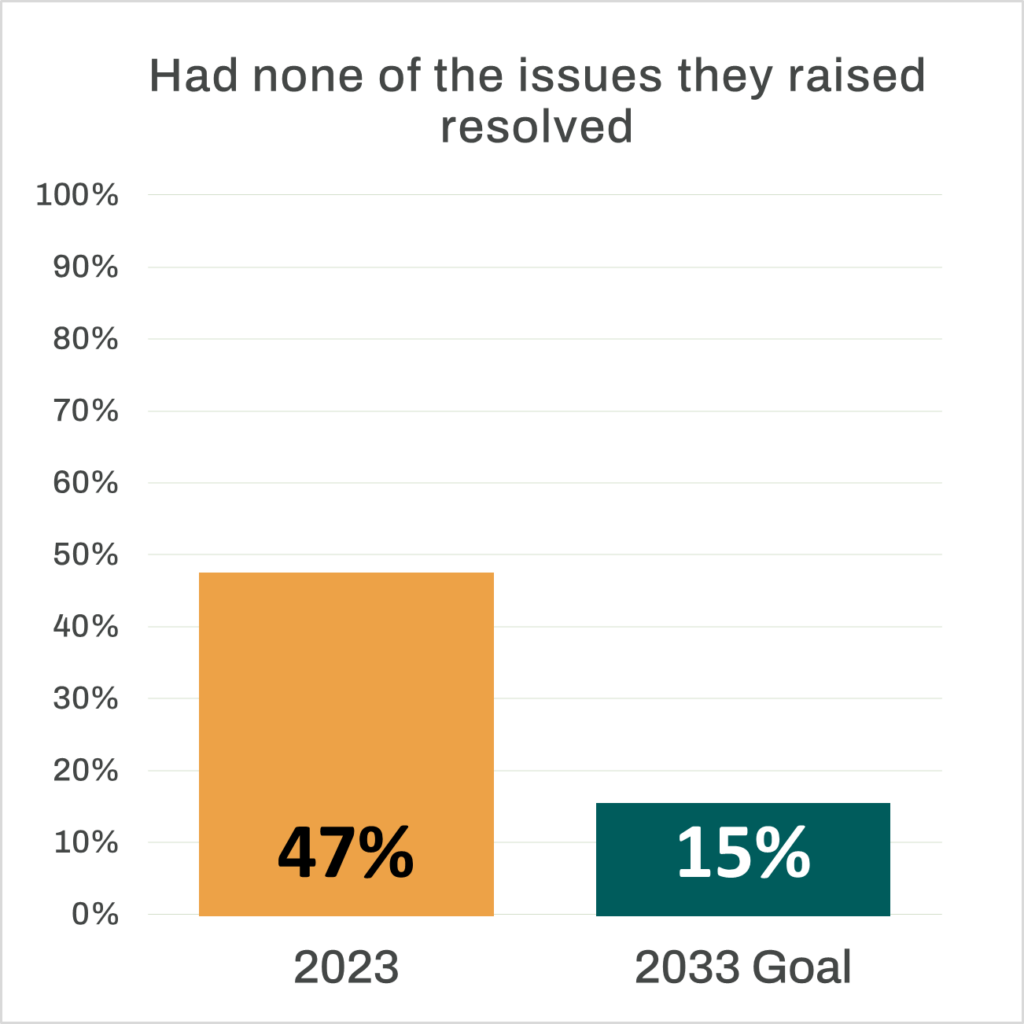
Resolution
By 2033 fewer than 15% of students that have raised access issues should report that none of those issues were resolved
Currently 47% of those who have raised access issues report that none of the issues they raised were resolved
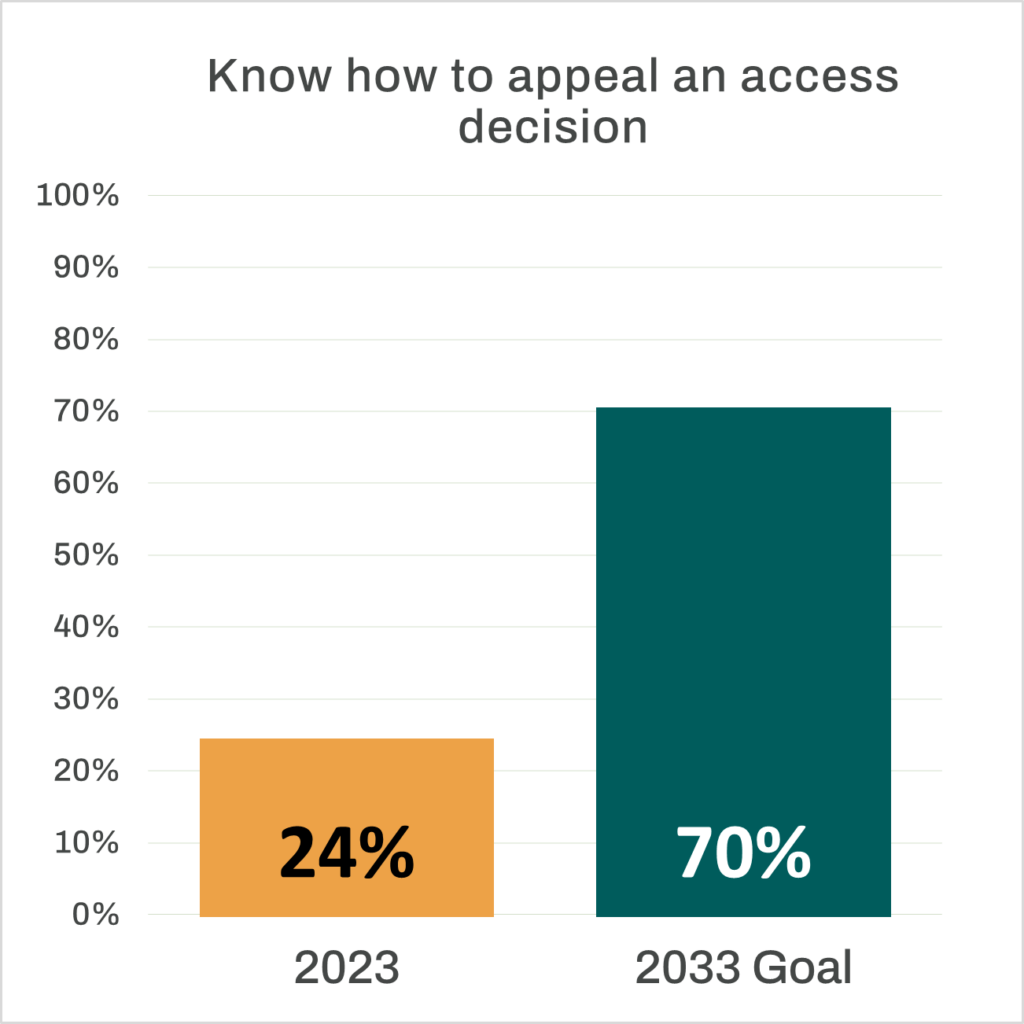
Escalation
By 2033 70% of students should know how they could appeal an access decision that puts them at a disadvantage
Currently 24% know how they could appeal an access decision that they feel puts them at a disadvantage
Principle 6: Equal Opportunities
Disabled students should be provided with the same non-academic opportunities from their institution as their non disabled peers.
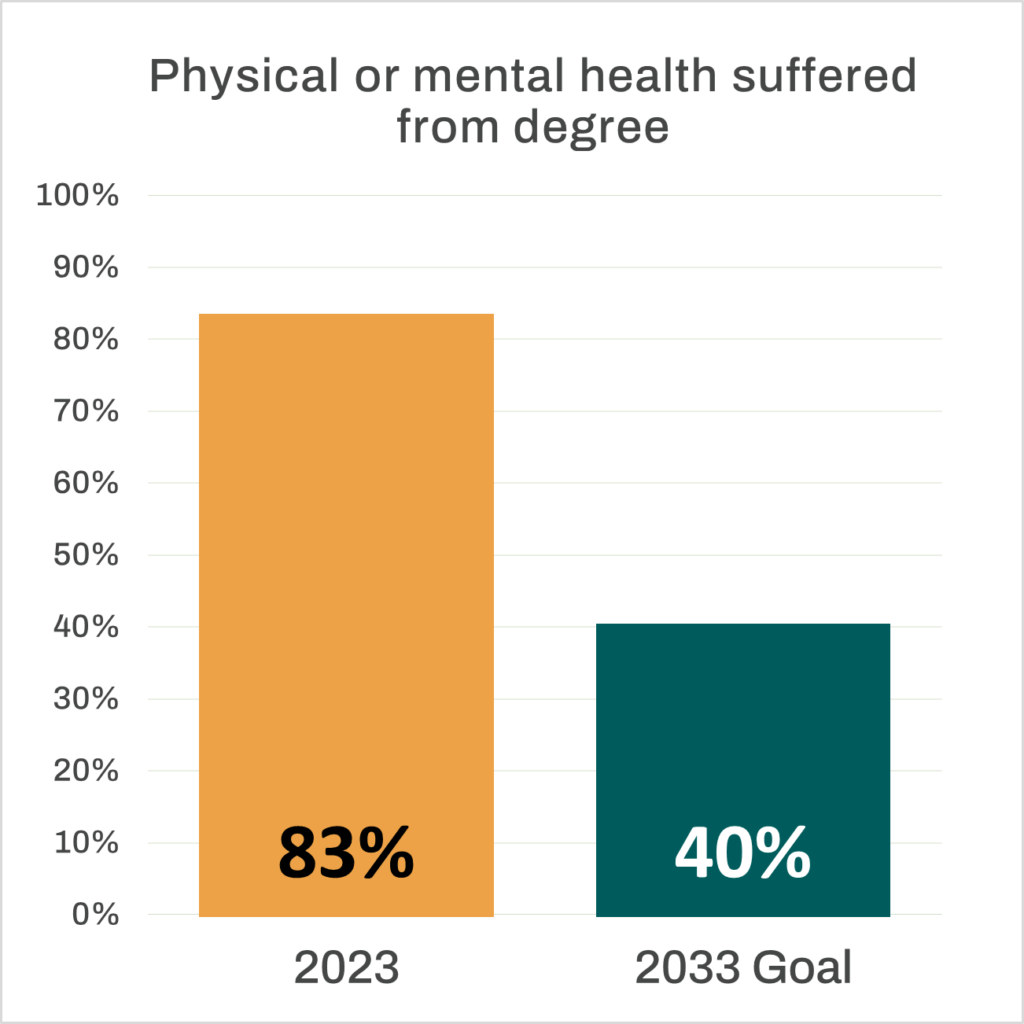
Health Opportunities
By 2033 fewer than 40% of students should feel that their physical or mental health has suffered from their degree
Currently 83% report that their physical or mental health has suffered from their degree
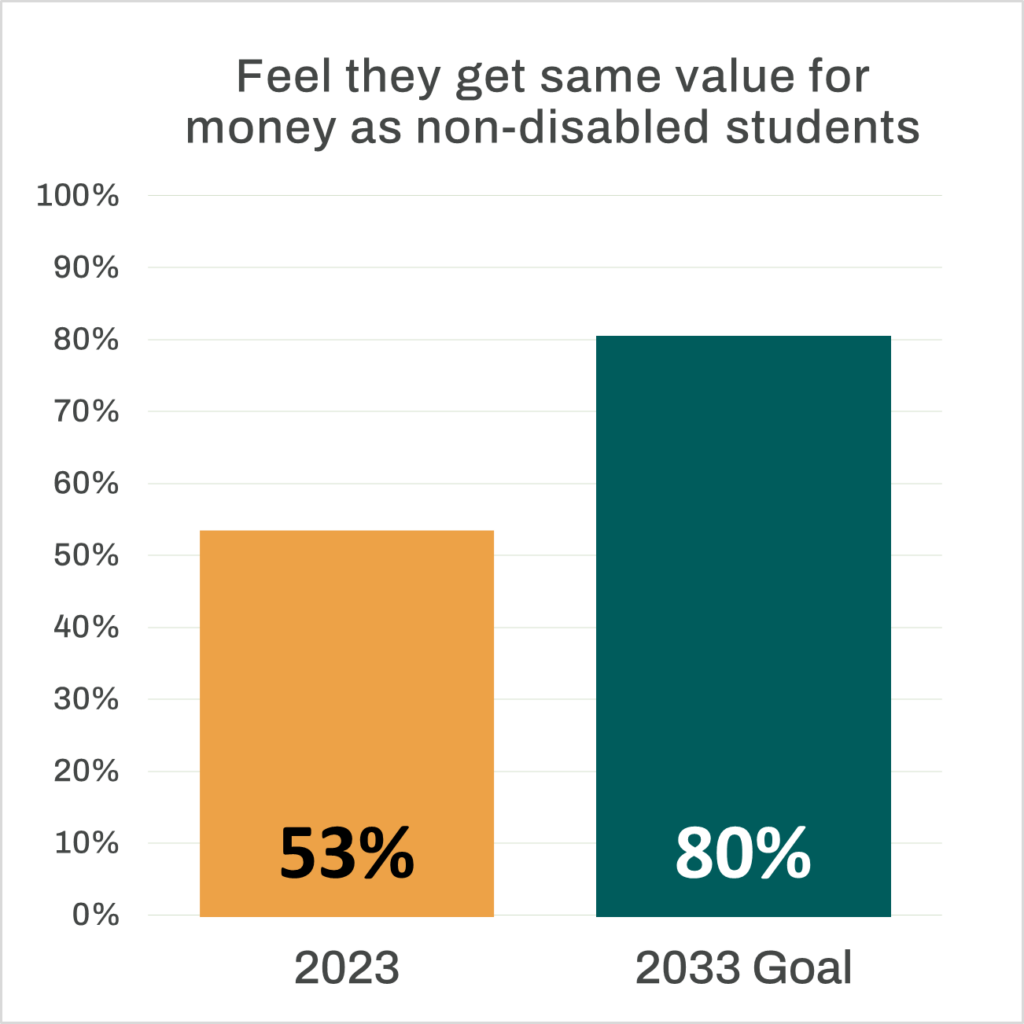
Financial Opportunities
By 2033 80% of students should feel that they have received the same value for money as their non-disabled peers
Currently 53% feel that they have received the same value for money as their non-disabled peers
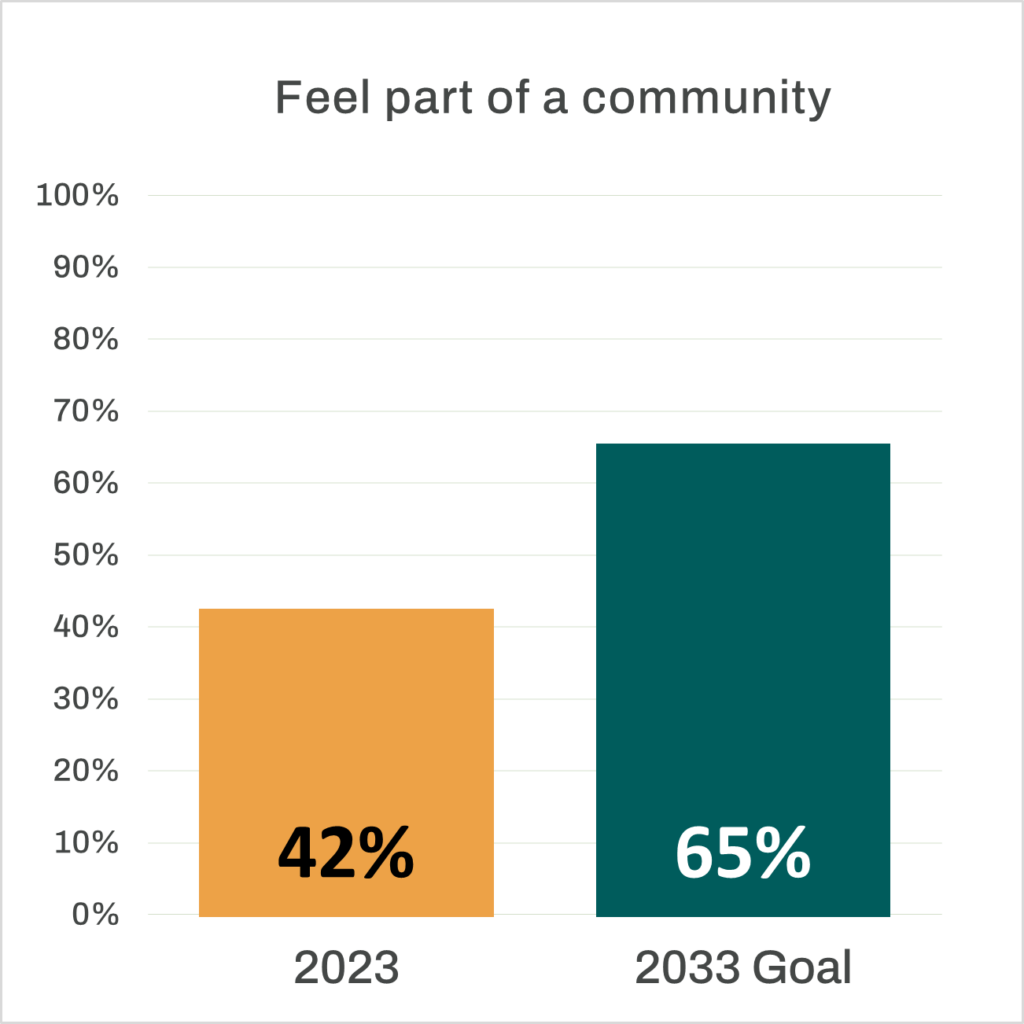
Social Opportunities
By 2033 65% of students should feel part of a community at their institution
Currently 42% feel part of a community at their institution